Text Representation


Solving a text categorization problem usually starts by deciding which text transformation to use; the traditional approach would be to decide on a Bag of Word (BoW) Representation. A BoW representation using q-grams of character and n-grams of words produces a satisfactory baseline (with term-frequency inverse document-frequency as its weighting scheme and linear support vector machine as the classifier, e.g., B4MSA). However, it cannot encode more information than the one used to learn the BoW and train the classifier.
Techniques in semi-supervised learning have been used to incorporate information into text representations. The basic idea is to convert a dataset into a labeled dataset where the labels are automatically identified. The Emoji Text Representation developed here followed this idea. The dataset used to train these representations is a set of tweets collected from Twitter’s open stream in Arabic, Chinese, English, French, Portuguese, Russian, and Spanish.
On the other hand, many competitions and datasets follow an equivalent structure to the approach mentioned above; these competitions can be used to increase the number of possible text representations. The Dataset Text Representation describes the dataset and competition sets used to create text representations.
Bag of Word (BoW) Representation
The first step to including more information in the representation is to be able to represent the text in a format amenable to different machine learning algorithms. Particularly, it is used a BoW representation with q-grams of characters (2, 3, and 4) and words; the constraint is that the q-grams are only computed on the words, and consequently, there are no q-grams between words. The exception is Chinese, which only uses q-grams of 1, 2, and 3. The BoW was learned from 524,288 tweets randomly selected from the text_models collection.
The BoW model is implemented with microTC; the only particular characteristic is that only the 16,384 more frequent tokens were kept in the representation. The BoW models for the different languages are found in:
These representations can be used as follows:
>>> from EvoMSA.utils import load_bow
>>> bow = load_bow(lang='en')
>>> X = bow.transform(['Hi', 'It is working'])
>>> X.shape
(2, 16384)
where the text Hi and It is working are transformed into matrix \(\mathbb R^{2 \times 16384}\).
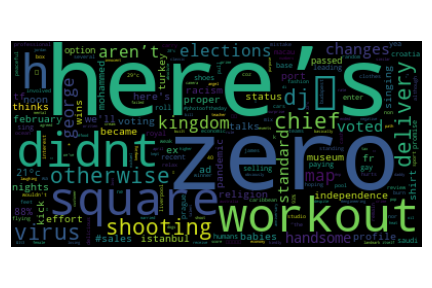
The BoW contains words and q-grams; let us depict in a wordcloud the words with the highest weight; this can be done with the following code.
>>> from matplotlib import pylab as plt
>>> from wordcloud import WordCloud
>>> _ = {bow.id2token[id]: w for id, w in bow.token_weight.items()}
>>> words = {k: v for k, v in _.items() if k[:2] != 'q:'}
>>> word_cloud = WordCloud().generate_from_frequencies(words)
>>> plt.imshow(word_cloud, interpolation='bilinear')
>>> plt.axis("off")
Emoji Text Representation
Transforming the dataset into a labeled dataset is similar to the one used in deepmoji. The idea is to use the emoji in the text as the labels. The process selects and removes the emojis in the tweets and keeps them as the labels of the text. The emojis kept are the ones that appear at least 1024 times alone, i.e., the text contains only one emoji.
The second step is to use the labeled dataset and the BoW model with a classifier; it was decided to use a Linear Support Vector Machine (implemented in sklearn.svm.LinearSVC). The methodology used is one versus the rest. The positive class corresponds to a maximum of 262,144 tweets containing only the label at hand, whereas the negative class corresponds to 262,144 randomly selected from the other labels. If there are not enough tweets, then it is used as many tweets as possible as long as the set contains the same number of positive and negative examples. For the negative class, only tweets with unique labels are used; however, if there are not enough, it is allowed to use tweets with multiple labels as long as it does not contain the positive class.
The following code uses the emoji representation in English using only the representation of the emoji identified with index 0.
>>> from EvoMSA.utils import load_bow, load_emoji
>>> bow = load_bow(lang='en')
>>> emo = load_emoji(lang='en', emoji=2)
>>> X = bow.transform(['This is funny', 'This is lovely'])
>>> emo.decision_function(X)
array([-0.89521935,  0.46341599])
The function emoji_information()
can be used to know the available emojis.
The information is stored in a dictionary where the keys are emojis,
and values contain additional information such as the performance (i.e., recall),
the number of examples of the positive class (i.e., number),
and the identifier (i.e., emoji). The following code shows an example:
>>> from text_models.utils import emoji_information
>>> emoji = emoji_information(lang='en')
>>> emoji['❤️']
{'recall': 0.6546198309081498, 'emoji': 2, 'number': 673530}
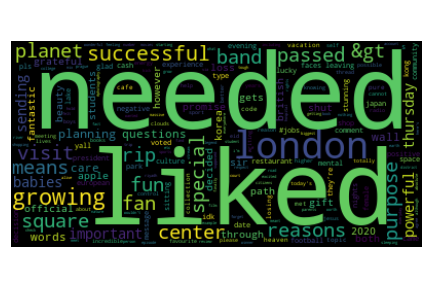
Complementing the previous wordcloud, the following code computes a wordcloud of the words that contribute the most to decide the positive class.
>>> w = emo.coef_[0]
>>> _ = {bow.id2token[id]: _w * w[id] for id, _w in bow.token_weight.items() if w[id] > 0}
>>> words = {k: v for k, v in _.items() if k[:2] != 'q:'}
>>> word_cloud = WordCloud().generate_from_frequencies(words)
>>> plt.imshow(word_cloud, interpolation='bilinear')
>>> plt.axis("off")
Dataset Text Representation
The idea of Dataset Text Representation is, on the one hand, to increase the number of representations and, on the other, to test their impact on the performance of a text classifier.
The datasets used are in Arabic, Chinese, English, and Spanish; these are text categorization problems taken from competitions such as SemEval, TASS, and IberLEF, among others.
The models were created using the approach one versus the rest, even when there are only two classes. Consequently, in a binary problem, there will be two models corresponding to each class being the positive class.
The function dataset_information() can be used
to know which are the available datasets. It returns a dictionary where the
the keys correspond to the dataset names and the values are the labels.
>>> from text_models.utils import dataset_information
>>> dataset = dataset_information(lang='en')
>>> dataset['HA']
array(['negative', 'neutral', 'positive'], dtype='<U8')
The model can be retrieved using the function load_dataset()
that requieres its name and the class index one wishes to use.
For example, to use the HA model
for the positive label, the following code can be used:
>>> from EvoMSA.utils import load_dataset, load_bow
>>> bow = load_bow(lang='en')
>>> ha = load_dataset(lang='en', name='HA', k=2)
>>> X = bow.transform(['Good moorning!', 'It is a cold and rainy day'])
>>> ha.decision_function(X)
array([ 0.8267016, -0.1237163])
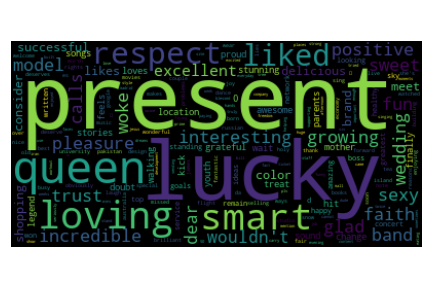
where the examples presented correspond to a correct classification. Following an equivalent procedure to the one used to compute the emoji’s wordcloud, on this occassion, it is computed the wordcloud of the dataset HA on the positive class.
>>> w = ha.coef_[0]
>>> _ = {bow.id2token[id]: _w * w[id] for id, _w in bow.token_weight.items() if w[id] > 0}
>>> words = {k: v for k, v in _.items() if k[:2] != 'q:'}
>>> word_cloud = WordCloud().generate_from_frequencies(words)
>>> plt.imshow(word_cloud, interpolation='bilinear')
>>> plt.axis("off")
Dataset and Emoji Text Representations
Considering that there is a linear model for each emoji and dataset, it is feasible to visualize them with the aim of learning more about the similarities and differences between the models.
Before starting the comparison, let us load the libraries used in the procedure.
>>> from EvoMSA.utils import load_bow, load_emoji, emoji_information, dataset_information, load_dataset
>>> from sklearn.metrics.pairwise import cosine_distances
>>> from sklearn.decomposition import PCA
>>> from matplotlib import pylab as plt
>>> from joblib import Parallel, delayed
>>> from tqdm import tqdm
>>> import numpy as np
The models are vectors where each component corresponds to a token;
the BoW assigns a weight to each token.
These weights are incorporated in the comparison by computing the
element-wise product of the coefficients obtained by the SVM (see m.coef_)
and the weight w.
>>> def weights(models: list, lang: str):
>>>     bow = load_bow(lang=lang)
>>>     w = np.array([bow.token_weight[i] for i in range(len(bow.token_weight))])
>>>     return np.array([m.coef_[0] * w for m in models])
The first step is to download the Emoji Text Representation.
>>> LANG = 'es'
>>> emoji_info = emoji_information(lang=LANG).items()
>>> emoji_models = Parallel(n_jobs=-1)(delayed(load_emoji)(lang=LANG, emoji=k)
                                       for k in tqdm(range(len(emoji_info))))
The Dataset Text Representation can be retrieved using the following code.
>>> dataset_info = dataset_information(lang=LANG)
>>> problems = []
>>> [[problems.append(dict(name=name, lang=LANG, k=k)) for k in range(len(labels))]
     for name, labels in dataset_info.items()]
>>> dataset_models = Parallel(n_jobs=-1)(delayed(load_dataset)(**x)
                                         for x in tqdm(problems))
The representations are stored in emoji_models and datasets_models;
these contain the coefficients estimated with SVM. The missing step is
to use the weights in the BoW model, which is done with weights().
These representations are set to form a matrix where the cosine distance of all
the pairs are computed, as can be observed in the following code.
>>> X = np.vstack([weights(emoji_models, lang=LANG), weights(dataset_models, lang=LANG)])
>>> distances = cosine_distances(X)
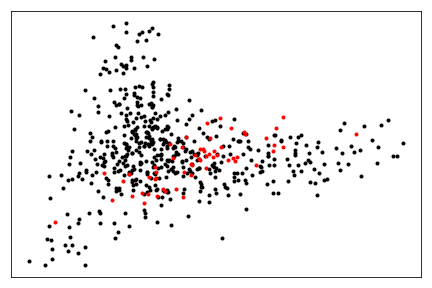
The final step is to visualize X using PCA
to reduce the number of dimensions to two. The figure presents in black the emojis
and red the datasets.
>>> pca = PCA(n_components=2).fit(distances)
>>> for x, y in pca.transform(distances[:len(emoji_info)]):
>>>     plt.plot(x, y, 'k.')
>>> for x, y in pca.transform(distances[len(emoji_models):]):
>>>     plt.plot(x, y, 'r.')
Example
Let us assume that there is a text classification problem that one wants to visualize using the above procedure. The first step is to load the libraries needed.
>>> from EvoMSA import base
>>> from microtc.utils import tweet_iterator
>>> import os
>>> from sklearn.svm import LinearSVC
The second step is to load the dataset into the memory; this can be done with the following instructions.
>>> tweets = os.path.join(os.path.dirname(base.__file__), 'tests', 'tweets.json')
>>> D = list(tweet_iterator(tweets))
It is time to estimate the parameters of the linear SVM, and scale the parameters obtained with the tokens’ weights.
>>> bow = load_bow(lang='es')
>>> m = LinearSVC().fit(bow.transform(D),
                        [x['klass'] for x in D])
>>> w = np.array([bow.token_weight[i] for i in range(len(bow.token_weight))])
>>> P = [w * c for c in m.coef_]
The problem is represented in the matrix P, the next step is to use P
and X to compute the cosine distance as follows:
>>> P_dis = cosine_distances(P, X)
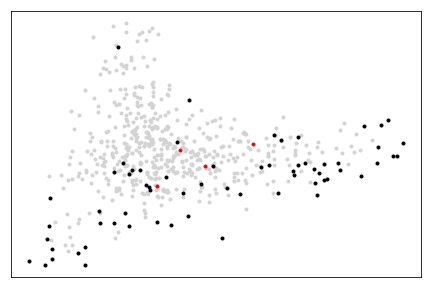
Let us depict the problem points along with the emoji and dataset points. In the following figure, the first 64 emojis are in black, the problem points are in red, and the rest of the emojis and datasets are in lightgrey.
>>> for x, y in pca.transform(distances[64:]):
>>>     plt.plot(x, y, '.', color='lightgrey')
>>> for x, y in pca.transform(distances[:64]):
>>>     plt.plot(x, y, 'k.')
>>> for x, y in pca.transform(P_dis):
>>>     plt.plot(x, y, 'r.')
Text Categorization
The idea is that a figure similar to the one produced above provides information about the performance of a system developed on the text representations used. For example, to complement the example, the following code uses the first 64 emojis and the BoW as text representations. These representations are combined using a stack generalization approach (see EvoMSA).
>>> from EvoMSA.utils import linearSVC_array
>>> from EvoMSA.model import LabeledDataSet
>>> coef, intercept = linearSVC_array(emoji_models[:64])
>>> emo = LabeledDataSet(textModel=bow, coef=coef, intercept=intercept)
>>> evomsa = base.EvoMSA(models=[[bow, 'sklearn.svm.LinearSVC'],
                                 [emo, 'EvoMSA.model.SVCWrapper']],
                         stacked_method='sklearn.naive_bayes.GaussianNB',
                         TR=False).fit(D, [x['klass'] for x in D])
The final step is to use the model to predict; the next code predicts two sentences in Spanish, i.e., Good moorning! and It is a cold and rainy day.
>>> evomsa.predict(['Buenos días!', 'Es un día frío y lluvioso'])
array(['P', 'N'], dtype='<U4')
Work to be done
The library aims to serve as a building block to developing Natural Language Processing systems, mainly text categorization, and to facilitate the process of mining events on Twitter. Consequently, there are more possible applications and research works than the ones described in this section. This section mainly focuses on possible improvements of complementary methodologies to the analysis and text representations explained.
One of the first problems that one will encounter while working with emojis and languages that do not have an ASCII representation is that the procedure used to create the wordcloud will not display the characters. For example, one can try to replicate the example in Section Bag of Word (BoW) Representation in Arabic (ar) and the output would be a cloud filled with boxes which is the the way the library represents those characters that cannot be displayed.
In Section Dataset and Emoji Text Representations, it is used PCA to visualize the distance (cosine) matrix of the text representations; however, other procedures can complement this visualization as well as other distance measures. On the other hand, the use of the coefficients to represent the models helps to give a general overview of the behavior of the models; however, if one is interested in exploring the models in a particular problem might be better to visualize them in terms of the problem. That is, the problem dataset can be represented with each model, and then use these representations to visualize them.
Section Text Representation presents a system that uses two text representations: the BoW and the 64 more frequent emojis. The section did not include a comparison nor present the system performance. Nonetheless, the model opens different research avenues, given the number of text representations available. The natural question is how to select those representations that produce the simpler model with the best performance. There are two follow-up questions about the procedure used to select the models; could the procedure be supervised or unsupervised? That is, the labels of the problem being solved are needed to make a better selection.